Turning fragmented operational reporting into a traceable view
Status: Discovery and concept — project defundedConfidential: Data has been anonymized
Overview
- Status
- Defunded after discovery and early concepts, before implementation.
- My role
- Primary product designer
- Team
- Product designer and product manager, with a technology team receiving product stories
- Users
- Business operations teams
- Areas explored
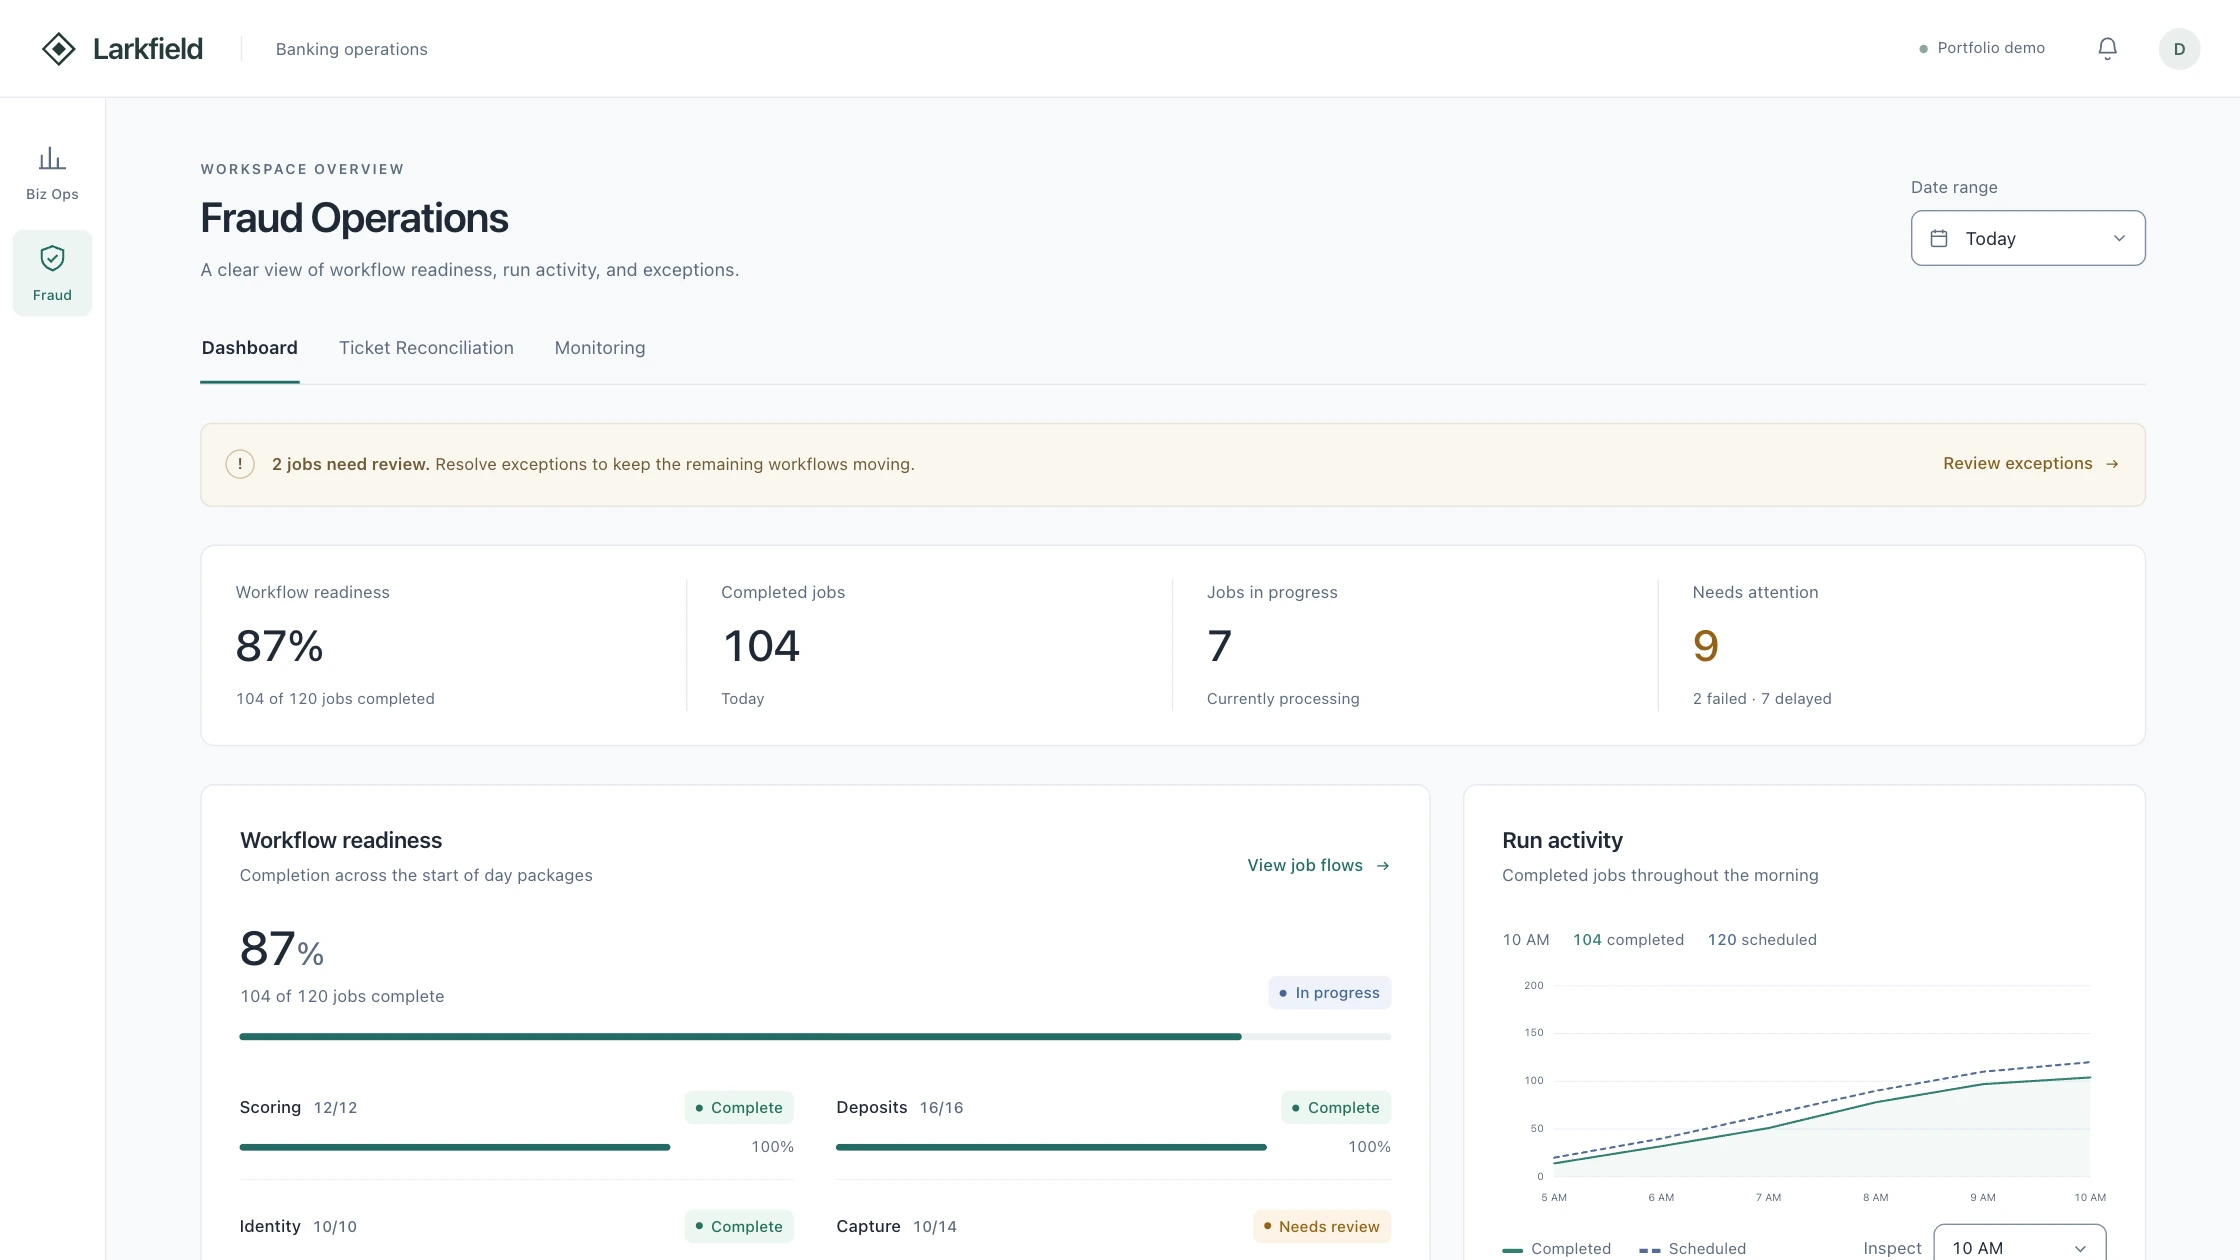
- Home overview, fraud, and customer-service call logs
Business operations teams monitored activity through a combination of existing tools, downloaded data, spreadsheet templates, and manually assembled reports. The process could reveal the metrics they cared about, but understanding where an unusual pattern originated required looking across multiple places and coordinating with technology operations.
As the primary designer, I led discovery sessions with end users and translated what we learned into early product structures and prototypes. I partnered closely with a product manager, who helped turn the work into stories for the technology team and served as my main design-critique partner.
The six-month engagement focused on discovery and initial ideation. The product did not reach implementation while I was on the project.
The problem
Tracing an unusual pattern back to where it came from meant looking across several places and coordinating with technology operations.

Context
To add · Statement
One sentence on why the work mattered
To add · Subheading
One line, two thirds of the page wide, on who struggled and why
Model
To add · Statement
One sentence on the model behind the dashboard: who watched what, and where the data came from
To add · Text
User roles, the metrics each role watched, and the data sources behind them, as a short list
How I got there
To add · Text
How you made sense of the discovery sessions with end users
Problem
The question
How might we help operations teams move from seeing an unusual metric to understanding where it came from without manually rebuilding the story across spreadsheets and disconnected systems?
What I inherited
To add · Text
The existing reports, tools, and spreadsheet templates you started from, and the design system you worked within
Constraints
To add · Text
The constraints that shaped the design
Process
To add · Statement
One line on the decisions made with the team
To add · Decision cards
Three decisions made with the team, in one row: a short title, who decided (product, design, technology, users), and a sentence or two each. The product manager was your main critique partner and turned the work into stories for the technology team
Ideation
To add · Statement
One sentence on the early concepts
The design principle that followed: an anomaly is useful only if a user can trace it to the relevant business area, underlying data, and next conversation or investigation.
Control
To add · Statement
One sentence on how the dashboard showed something unusual
Showing what's unusual, and where it came from.
To add · Showing what's unusual, and where it came from.
Three wide cards, text left and a screenshot right: how an anomaly was shown (known patterns or computed; severity, confidence, or deviation), what needed human validation, and the filters and drill-down that let people trace a number. Don't call it AI unless the original technical approach supports it
Failures
To add · Statement
One sentence on following an exception to its source
To add · Text
How someone follows an exception or a job that needs review back to its source, and where the design's help stopped
Testing
Learning what users could not easily articulate.
I reviewed the prototypes with end users.
- One user told us the concept felt like we were “reading their mind.”
- They hadn’t been able to describe the interface they wanted in advance, but the prototype gave them something concrete to react to.
- The prototype helped users recognize a more direct way to monitor activity and investigate unusual signals.
- I treat that reaction as a signal about the prototype, not as usability evidence on its own.
The project was defunded before implementation, so the work did not produce measured operational outcomes.
To add · Text
The research and design choices that made that reaction possible, and a design change caused by feedback
To add · What I learned
One or two sentences, in your own words, on what this project taught you
Takeaways
To add · Takeaways
Three lessons, each a short title and a sentence or two
What I would test next
To add · Text
What you'd test next, and why